Subscribe Now - Standard: only $299 per year or Premium: only $399 per year - Click Here
|
|
Login:
HelpCheck out our video overview/tutorials here. text size
AboutThis website evolved after I published my book How to Invest in Gold & Silver. When I was working on the Second Release, I had an idea to create a database of information for gold and silver mining stocks. So I started analyzing every gold and silver mining stock with a market cap over $30 million that trades in North America (the database now includes many stocks under this valuation). Before I began to do my analysis, I had to identify what data to collect. I came up with about 60 columns of data, including the concept of a rating. I gave each stock a rating from 1 to 5 with increments of .5. Each rating has a specific potential future valuation (see Ratings). I already had categories for each stock (see Categories), which I described in my book. Then I added risk level. Combining a rating, category, and risk level, created an ideal way to identify a stock at a high level. What was missing was an easy way to do searching. That is what this new website provides. In April 2012, another investor approached me with an idea to merge our websites. At first I was apprehensive, but after seeing that his site was very similar and offered several enhancements - including easy searching - I agreed. The outcome is this site, which meets my goal in a more comprehensive manner. Now investors have a site to easily find undervalued gold and silver mining stocks. If I would have had this when I started investing in Junior gold and silver mining stocks in 2004, I would have made (and saved) thousands of dollars. There is one weakness with this website and that is up-to-date information. Because the database has grown into 500 companies, it is impossible to keep the analysis information up to date. The best I can do is give you the date of the last analysis and then allow you to do your due diligence (DD) and see what has changed. Moreover, it is not beyond me to make mistakes when I do my research. It is your responsibility to review my analysis and data to look for discrepancies. There are many data points that can effect the future valuation of a stock, any one data point can impact that valuation. Note: It is my goal to analyze every company at least once a year and update its information. Because the analysis date is always in the past, there are two views of the data. There is the current view, which is displayed in the search & compare page (refer to Research) and the last analysis data, which is displayed in the profile page (see Profile). I will explain both of these in their own sections. The search & compare page is a spreadsheet type layout that attempts to include as much current information as possible. The dates of each data point are available. The profile page shows the last analysis data next to the current data in a comparison format. The strength of the database is the ratings, combined with the risk level. This gives you an easy way to find undervalued companies and manage risk. Although, mining stock valuations can change quickly, and the ratings are only potential valuations. Thus, if you use the ratings to find leads, please do your own analysis before you invest in a stock. I will admit that I trust my valuations and have invested in the most of companies with a valuation of 3.5 or higher. This site is for experienced investors who are willing to validate my conclusions with their own analysis. If I'm right about the future valuations of many of these stocks, then the current valuations are incredibly cheap. Investing in mining stocks is a crapshoot. No one can avoid bad stocks. For this reason, I recommend a portfolio of stocks. If you invest in less than 10 stocks, then you increase your risk. My book recommends a balanced portfolio that includes bullion, majors, mid tiers, and juniors. I think an ideal portfolio includes gold mutual funds for majors, ETFs for mid tiers, and 20 to 30 juniors. This web site can help you find leads to build that portfolio. BookI published the first edition of How to Invest in Gold & Silver in October 2010. I subsequently updated it in 2011 (Second Edition) and 2012 (Third Edition). I am a metaphysical author and have seven metaphysical books for sale on Amazon and B&N. In 2009, I was in-between projects and a thought popped into my head: why don't you write a gold investing book? After all, I thought, there aren't any good ones on the market. It seemed like a perfect fit. I was a writer, I knew how to invest in gold and silver mining stocks, and there was a need for someone to write it. I don't know about you, but when I started out investing in mining stocks, I bought a few books on the subject and couldn't find anything that was helpful. In fact, the quality was awful. I wanted someone to explain to me how pick gold and silver mining stocks, and all of the particular data points I needed to research. It turns out that investing in gold and silver mining stocks is difficult to learn. In fact, it requires at least five years of investing to have a good idea of what you are doing. With my book, I think I can help you to become fairly proficient in two years - if you read the book at least twice, and take notes. Categories & Category Codes
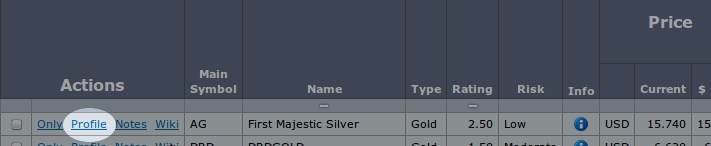
CompaniesThis page is the list of all companies in the database. For each company you will see something similar to the following: The "company name" link takes you to the detailed company profile page. The "research" link takes you the search & compare page. The "notes" link takes you to the notes page. The "wiki" link takes you to the wiki page. Note: The Wiki page is only for members. Defaults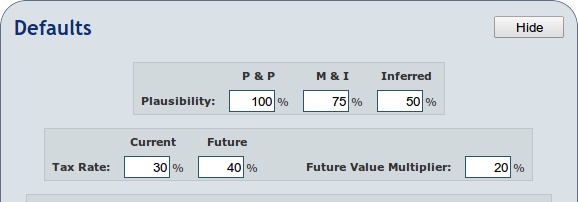
Defaults are values we sometimes use for calculations. There are two types. The first type are values we plug in to calculations. An example of this is the future gold price which we use to estimate future profitability. The other type is to provide a reasonable estimation where data is simply not available. An example of that may be "cash costs". Whilst only rough guesses they allow us to compare all companies regardless of size and stage of development and/or production. Common sense is required for these estimations; we may be able to compare a small junior explorer with a producer but that simple comparison could be very misleading. The road from exploration to production is a difficult one. But... it can serve to show you the type of value progression a company could make if things continue to go well. Defaults are configured in two places. The first is your account settings. These are here for convenience. They will be used on each company profile page, and they will automatically appear on the search & compare page instead of you having to change them every time. We have pre-populated the defaults with what we believe are sensible values. However, they are there to be changed if you wish. An example would be if you were more bullish than us on the price of gold - you can simply set your future gold price The defaults you can configure are as follows:
PlausibilityBy plausibility we mean how much are we going to value each measure. Proven and Probable reserves are much more reliable than inferred resources. To be conservative we give different values for each type. The table on the right, shows the site's default settings which you are free to change. What is means is that 2 million ounces of inferred gold is really only equal to 1 million ounces of proven and probable ounces. These values are used to calculate the potential profit based on current resources.
Spot PricesThe spot prices should be correct and not require any modification. On the search & compare page, once you run a search the spot prices are essentially frozen until you reload the page fresh. This is so your valuations don't keep fluctuating around as we get 15 minute spot price updates.
Future Spot PricesThese are projected future gold and silver prices in 3-5 years. I think these are conservative, and you might want to increase them. They are used for calculating the future market cap, future market cap growth, and future cash flow.
Default CostsThese are the defaults costs (which will likely increase over time), and the default recovery rate. These are used to calculate current and future cash flow, and future profitability. The costs are used to fill-in where we don't have a value. The recovery rate is used when we don't have a recovery rate. These values can really affect valuation and profitablity. A company's NI 43-101 may show they have 50 million ounces of silver, but if their recovery rate is only 60% that means they can only expect to actually realise 30 million of those ounces. Visible Columns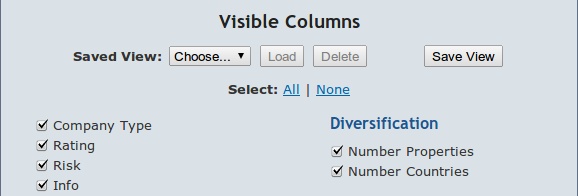
The research view has many columns, some of which may not be of use to you. To be as flexible as possible we allow you to choose which you want to see and which you don't. In addition, members can save these view and load them later. You can pick (using the check-boxes) the columns you want to see on the search & compare page. After you click the Update button, it will reload the research columns (if you have the search & compare page populated). If you want to view more than one set of columns, you can save the view using the Save View button. For instance, for some companies categories, such as majors you probably want to see P&P Reserves. You could name this view Majors. If you use more than one view, there is a "Load" button to switch views. There is also a "Delete" button, if you decide you no longer want to use a view that you created. When you create a new view clicking the "Save View" button, you are prompted to either "Create New View" or "Overwrite". The Overwrite button is used to update an existing view. Notice there are links for "Select All" or "Select None". Once you select one of these links, you can then change a few columns and click Update. Nearly all of the columns on the search & compare page are listed in the Visible Columns section. These columns will be explained in the research section. Membership
1 Year
only $299click here
Mining 101This menu option is actually Chapter 10 - How to Value Gold and Silver Mining Stocks from my book How to Invest in Gold & Silver. This chapter is packed with useful information on how to analyze a gold or silver mining stock. Unless you have been investing in these stocks longer than I have (about 9 years), you should read this chapter. 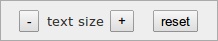
One of the coolest things on this site is the ability to increase the size of the font on some pages. Because the Mining101 page is a long article, reading it with a large font is much easier. All you need to do is click on the + until you find the size you prefer. Click the reset button to return to the default size font. NotesBelow is an example Notes page. These are notes that I made during the last analysis. [Are used for inserted explanations]. Abzu Gold Last Analysis: (15/04/2012)[Last Analysis is the last analysis date, when the current rating was made. The format is dd/mm/yyyy. References to last update below are referring to this date.] Notesn/a[These are random notes I made during the last analysis. Refer to the last analysis date above] Gold Price (last analysis) ($)1650.00[This was the gold price at the last analysis.] Silver Price (last analysis) ($)32.00[This was the silver price at the last analysis.] Stock Price (last analysis) ($)0.24[This was the stock price at the last analysis.] Stock Price USA 12 Months Ago ($)0.70[This was the stock price 12 month before the last analysis.] Stock Price Change Last 12 Months (%)-65.71%[This was the stock price change from the last analysis and 12 months prior.] Stock Price USA 5-Year High ($) (including date).89 Cents - 2/15/2011[This was the 5-year high stock price (including its date) from the last analysis.] Stock Price USA 5-Year Low ($) (including date).19 Cents - 2/15/2012[This was the 5-year low stock price (including its date) from the last analysis.] People (wag)Appear to be good explorers. I'm not so sure about developers.[This my analysis of the management team from the last analysis. Note that this often a cursory guess. Wag (wild ass guess).] Mine LocationsWest Africa (Ghana)[These are the mine/property locations from the last analysis.] Local Issues (wag)Potential political issues, although stable today.[These are local issues that I found during the last analysis. Note that this often a cursory guess. Wag (wild ass guess).] Ownership100% of 6 claims, and 51% of 10 claims.[This is the ownership stakes in their properties from the last analysis.] Country of IncorporationCanada[This is the country of incorporation - where the company is based.] Gold PropertiesTwo multi-million oz deposits, plus 14 identified targets on 250,000 acres. They also have 9 JVs on their large land holdings.[This is my description of the gold properties from the last analysis. This is quick overview and can include other metals.] Silver Propertiesn/a[This is my description of the silver properties from the last analysis. This is quick overview and can include other metals.] Hedgingn/a[This is my description of any gold or silver hedging from the last analysis. Sometimes I will include gold or silver loans.] Shareholder Friendly (wag)Likely to get diluted[This is a quick overview of my opinion if the company is shareholder friendly from the last analysis. Note that this often a cursory guess. Wag (wild ass guess).] Flagship PropertyTwo potential Flagships.[This is if they have a flagship property (2 million oz gold or 40 million oz silver) or my opinion that they have a potential flagship property from the last analysis.] Ore Grade (wag)High grade surface mines[This is my description of the ore grade from the last analysis. Note that this often a cursory guess. Wag (wild ass guess).] Drill Resultsn/a[This is my description of past drill results from the last analysis.] Rating Historyn/a[This is used to document any rating changes. It includes the reason for the rating change, along with the date of the change.] Portfolio Management
Create PortfolioWhen you create a new portfolio you will see the following screen: 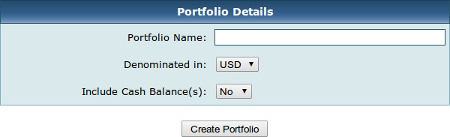
The first two options are self-explanatory, you give your portfolio a name and a currency denomination. The default is US Dollars (USD). Please note: Picking a currency does not restrict you to stocks denominated in that currency. For example, you could create a portfolio denominated in GBP but still add stocks from the TSX or TSX-V denominated in CAD. Our software can take this into account quite happily. The next option If you leave We would recommended that you change If you do decide to set it to 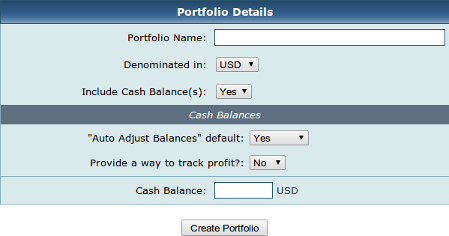
The You can also select Then next option to select is If you change Note: that this is recommended to use. I will explain why below. 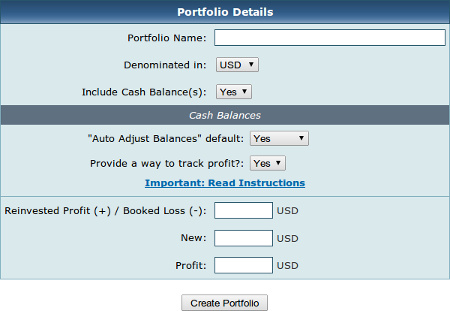
The Reinvested Profit (+) / Booked Loss (-)This value represents the amount of money you have lost and any profits you have reinvested. Most of you probably won't haven't tracked reinvested profits and booked losses (stocks sales at a loss) previously. The best way to think of it is as a modifier to the portfolio which takes into account past events that would otherwise be hidden and have no effect on the totals. If you don't know this value, then leave it as zero. You can only enter a positive or a negative number, so the values offset. If you reinvested $1000 and lost $1250, then you would enter -250. The nice thing about this is that even if you begin with zero, in the future you can change it if you need to. Normally, you will only add this value when you create the portfolio and it will then adjust automatically from future stock purchases and sells. NewThis is the cash balance in your brokerage accounts. It's considered new cash, because it has not been used yet to purchase stocks. ProfitYou can enter a starting balance if you have tracked this in your current brokerage accounts. Note that once you create a portfolio, this balance will automatically adjust based on stock purchases and sells. You can also edit this value at any time to adjust the portfolio profit if necessary. Edit Portfolio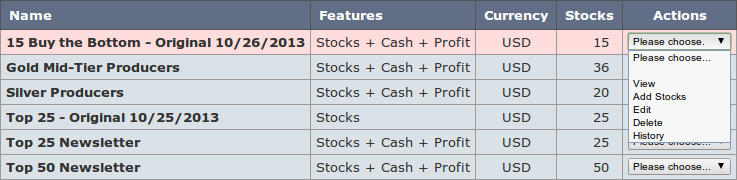
When you click the The easiest way to open a portfolio is to simply hover over a portfolio (it will turn light red) and click one. This is same thing as selecting Other ActionsView: Exactly the same as click the portfolio row. Click here for more details.Add Stocks: Add stocks to the portfolio. This can also be done from the portfolio display screen by clicking the Edit: Use this action to edit the portfolio name, or the features you selected when you setup the portfolio. 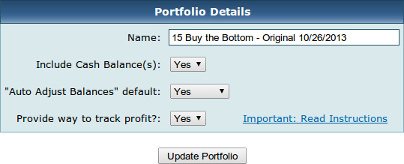
This screen gives you the ability to make a change to your initial setup. The cash and reinvested profit values can be edited when you open the portfolio. There is an edit button at the bottom right of the portfolio. Delete: This is self explanatory. This is how you delete a portfolio. History: This opens a screen and displays the history of the portfolio. 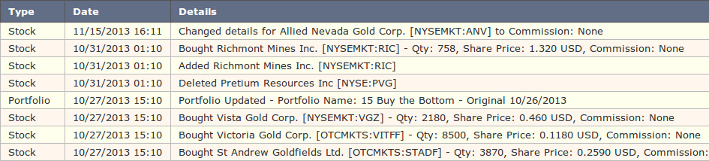
In addition to the actions on the main screen, you can also select actions when the portfolio is open: View Portfolio (No Stocks Yet)New PortfolioInitially, in a new portfolio you will be presented with the following screen.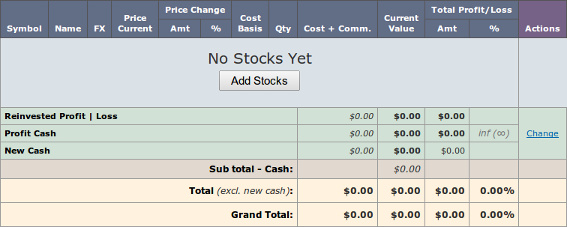 The first thing to do is add some stocks.
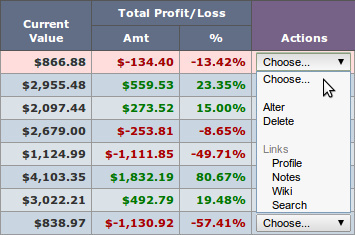
Adding StocksWhen you first create a portfolio is will not have any stocks and it will look like the screen above. Click the 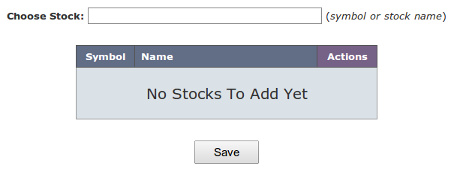
Enter either a stock symbol or a stock name. If the stock is already in your portfolio it will not appear in the list. This prevents you from adding a stock twice. 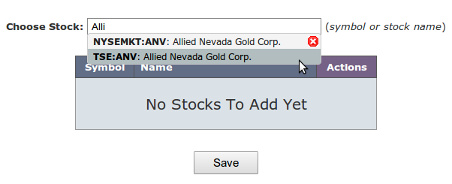
Usually the stock will appear with more than one symbol. You need to select the symbol that is in your brokerage account. If you don't know, open your brokerage account and check. For Allied Nevada, I know that I don't buy stocks on the TSE (Toronto Stock Exchange), so it has to be NYSEMKGT:ANV). 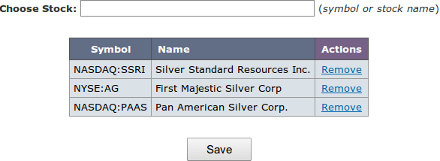
After you add several stocks, they are not saved by default. Once you click save, it will save the added stocks and display your portfolio. If you are going add a lot of stocks, be careful not to hit enter, which will automatically result in a Save and take you to the open portfolio screen. You will then to need to click View Portfolio (Established)
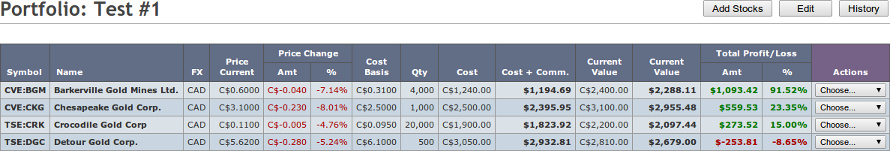
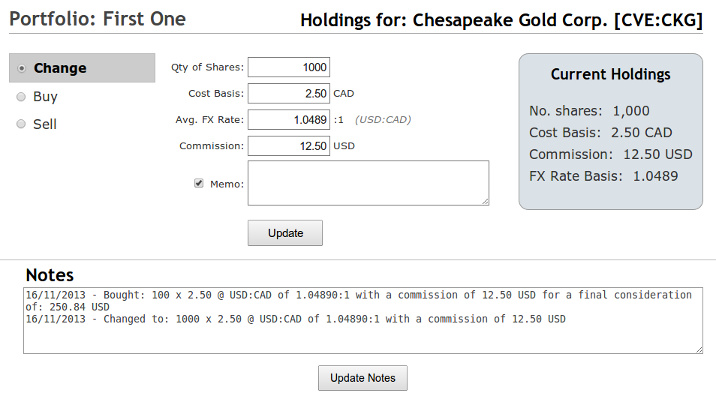
When you have stocks in your portfolio you will see something similar to the following:
|
|||||||||||||||||||||||||||||||||||||||||||||||||||||||||||||||||||||||||||||||||||||||||||||||||||||||||||||||||||||||||||||||||||||||||||||||||||||||||||||||||||||||||||||||||||||||||||||||||||||||||||||||||||||||||||||||||||||||||||||||||||||||||||||||||||

Upside
|
Downside
|
Research
The search & compare page is the heart of the website. This is where you will spend all of your time doing research to find the best stocks. First you will do a search to narrow your stock list, then you will analyze the output on the search & compare page. The output is a spreadsheet-like format where you can determine the columns that are displayed (see Visible Columns).
When you first open the search & compare page, it is empty. You have three choices to populate the output.
Each of these is explained elsewhere in the help file, but they essentially allow you to select a list of stocks. Once you have used them a couple of times, it is simple to do. This section of the help file is to explain the output.
When I first saw the output, I was a bit intimidated. What is a Short-List? And what are those Actions? Trust me it's simple, once it is explained...
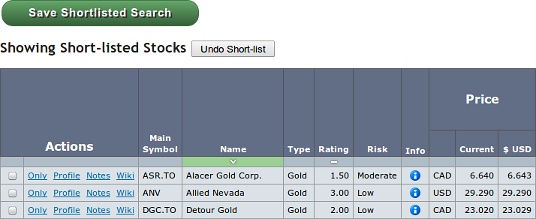
Once you run your first search all of the stocks matching that criteria will be displayed. You can then modify the results using the check-boxes to the left. What you do is check the stocks you like and click the "Short-list" button. Then if you want, you can save that short-list to display again later. Or you can revert to the original list of stocks by clicking the "Undo Short-list" button.
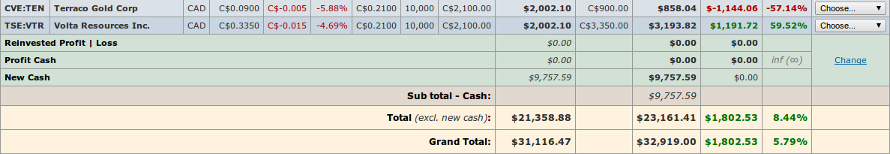
The Actions are easy to understand:
- Only: Display only that one stock in the output.
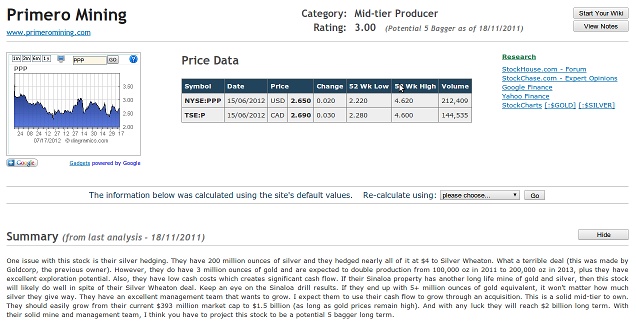
- Profile: Display the stock profile.
- Notes: Display the stock notes.
- Wiki: Display the stock wiki (hidden from non-members).
Sorting
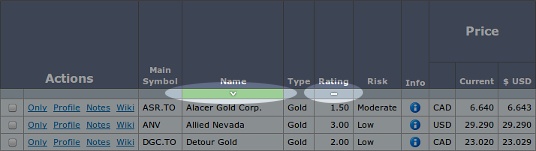
If the column below the column name is green, then that is the actively sorted column. "v" is descending, and "^" is ascending. Also, if a column has a "-" symbol in the column below the column name, then that column can be sorted.
Calculated Columns
For all calculated columns, if you click anywhere in the heading it will display the calculation.
Column Descriptions
Actions
These are links that perform specific actions:
- Only: Display only that one stock in the output.
- Profile: Display the stock profile.
- Notes: Display the stock notes.
- Wiki: Display the stock wiki (hidden from non-members).
Main Symbol
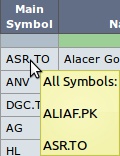
This is the main stock symbol, or generally where the stock is based.
If you click on the symbol, it will display all North American symbols (these are usually both the US symbol and Canadian symbol). You can also see these symbols in the profile page.
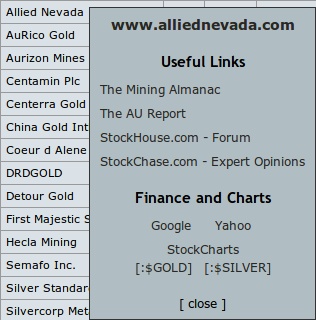
Name
This is the stock name.
If you click on a stock name, you will get a pop-up of useful links, including a link to their website, forums, current charts, and a comparison chart to gold and silver.
Type
Currently this is only Gold or Silver. It is my opinion if the company is primarily a gold miner or a silver miner. In the future, this will be expanded.
Rating
This is the stock rating.
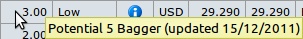
If you hover over a rating, it will display the description of the rating and the last analysis date.
Risk
The values include High, Moderate, and Low. This is my subjective opinion and is based on a variety of factors (see Mining101). The biggest weight is on location and potential cash flow.
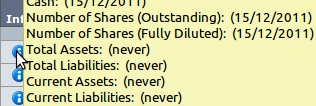
Info
You'll notice the following icon: ![]() . If you hover over this icon, you will see the last date each column was updated
. If you hover over this icon, you will see the last date each column was updated
Price
This is divided into 3 sub-columns. The currency of the main symbol, the price of the main symbol and the equivalent in US dollars.
Note:All other columns are standardized to USD for comparison purposes.
Category
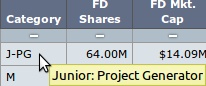
This is the stock category (see Categories & Category Codes.
If you hover over the Category, it will display the description of the category code.
FD Shares
This is the number of fully diluted shares from the last update (check info for the last update). Refer to the Profile for the number of common shares.
FD Mkt Cap
This is the fully diluted market cap, using the fully diluted shares and the current stock price (check info for the last update).
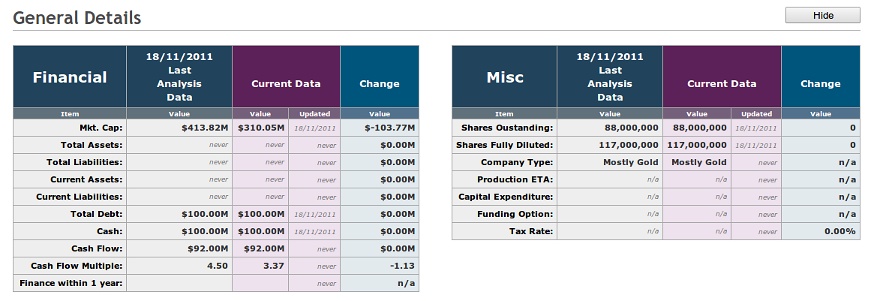
Last Analysis
- Mkt Cap: This is the fully diluted market cap from the last analysis.
- Date: This is the date of the last analysis.
- Change %: This is the % change in market cap since the last analysis.
Finances
- Debt: This is the current debt (check info the last update).
- Cash: This is the current cash (check info the last update).
Current Cash Flow
- Amt: This is the calculated current cash flow. The calculation is:
Annual Cash Flow = (Gold p/a x (Spot Price - Cost)) + (Silver p/a x (Spot Price - Cost))
- Multiple: This is the calculated cash flow multiple. The calculation is:
Cash Flow Multiple = Mkt. Cap / Annual Cash Flow
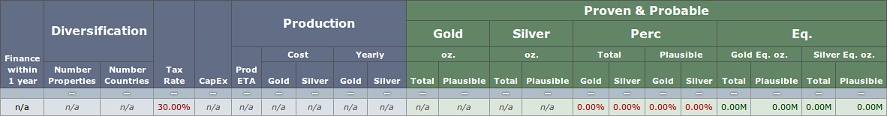
Finance within 1 Year
This is for juniors that likely will require financing within one year because they are low on cash. This will likely be n/a for most companies in the near term.
Diversification
- Number of Properties: This is the number of properties a company owns.
- Number of Countries: This is the number of countries where their properties reside.
CapEx
This is the CapEx requirement of their current project.Production
- Prod ETA: This the expected production year of their current project.
- Cost Gold: This is the current estimated operation costs (cash costs plus additional operation costs) for gold.
- Cost Silver: This is the current estimated operation costs (cash costs plus additional operation costs) for silver.
- Yearly Gold: This is the current estimated yearly operation costs for gold.
- Yearly Silver: This is the current estimated yearly operation costs for gold.
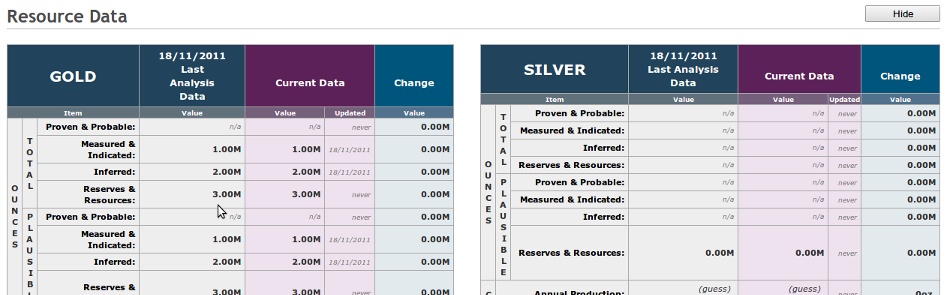
Proven & Probable / Measured & Indicated / Inferred / Reserves & Resources
I have included the column descriptions for all four resource categories here, because the descriptions are the same. However, I need to clarify what these four categories represent.
- Proven & Probable: This category is mainly for producers, and because there are less than 90 producers, many companies do not have P&P reserves.
- Measured & Indicated: The important thing to understand about this category is that it is inclusive of P&P reserves. Thus, M&I also include P&P.
- Inferred: The only thing I need to say here is that I often estimate additional inferred resources beyond the 43-101 resource estimate. For instance, if a company has been drilling and having good results, I will often give them some credit and pad their inferred resources. I don't want to be blind-sided by a news release, such as Barkerville Gold reporting 10 million oz in June 2012.
- Reserves & Resources: This one is easy. This is total reserves and resources. It is M&I, plus Inferred.
- Total Gold oz.: Total gold ounces.
- Plausible Gold oz.: Total plausible gold ounces. Plausible gold is defined in defaults (refer to Defaults).
- Total Silver oz.: Total silver ounces.
- Plausible Silver oz.: Total plausible silver ounces. Plausible silver is defined in defaults (refer to Defaults).
- Gold Total Perc: This is the percentage of gold as a percent of total resources (gold and silver).
- Silver Total Perc: This is the percentage of silver as a percent of total resources (gold and silver).
- Gold Plausible Perc: This is the percentage of gold plausible ounces as a percent of total gold resources. For instance, let's say you have 1 million oz of gold resources, but only 800,000 are plausible. That would calculate to 80%.
- Silver Plausible Perc: This is the percentage of silver plausible ounces as a percent of total silver resources.
- Total Gold Eq oz.: This is a calculation that combines the total gold resources and total silver resources into gold resources (total ounces). It uses the current price of gold and silver to determine the gold/silver ratio.
- Plausible Gold Eq oz.: This is a calculation that combines the total gold plausible ounces and total silver plausible ounces into total gold plausible ounces. It uses the current price of gold and silver to determine the gold/silver ratio.
- Total Silver Eq oz.: This is a calculation that combines the total gold resources and total silver resources into silver resources (total ounces). It uses the current price of gold and silver to determine the gold/silver ratio.
- Plausible Silver Eq oz.: This is a calculation that combines the total gold plausible ounces and total silver plausible ounces into total silver plausible ounces. It uses the current price of gold and silver to determine the gold/silver ratio.
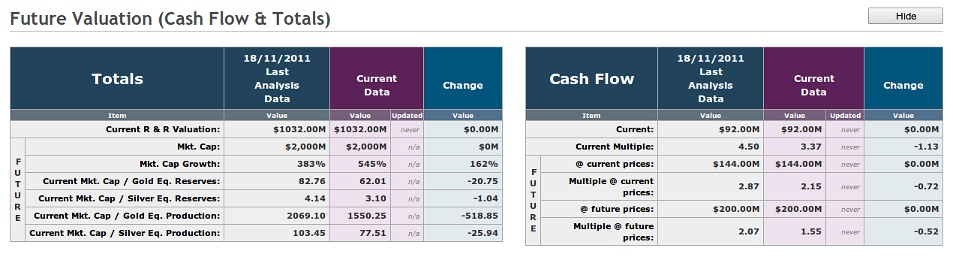
Future Estimated (WAG)
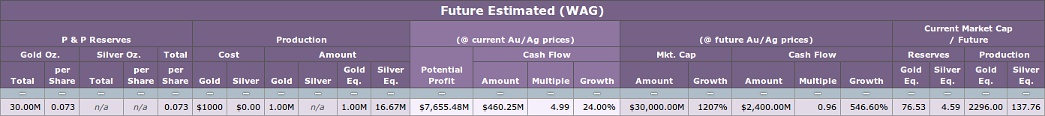
This section is the most important part of the search & compare page and the entire website. This is where we project into the future and compare that future with the present. This is where we find highly undervalued stocks.
Note: Because we are projecting, these are guesses (WAG = Wild Ass Guess).
P & P Reserves
Total Gold Oz.: These are projected reserves in 3-5 years. Note: I'm using the word reserves loosely here. What I'm really after is mine-able gold/silver. Many mid-tier and junior companies do not spend the money to turn their M&I into P&P. But that doesn't mean it isn't mined.
Per Share Gold Oz.: This is the projected gold reserves divided by current fully diluted shares.
Total Silver Oz.: (refer to Total Gold Oz.)
Per Share Silver Oz.: (refer to per Share Gold Oz.)
Total per Share: This is the projected reserves divided by current fully diluted shares.
Production
Gold Cost: This is the project future (3-5 years) gold cash costs, plus additional operation costs.
Silver Cost: This is the project future (3-5 years) silver cash costs, plus additional operation costs.
Gold Amount: This is the projected production ounces of gold on an annual basis in 3-5 years.
Silver Amount: This is the projected production ounces of gold on an annual basis in 3-5 years.
Gold Eq. Amount: This is a calculation that combines the projected gold production and projected silver production into projected total production (total annual ounces). It uses the default (refer to Defaults) future price of gold and silver to determine the gold/silver ratio.
Silver Eq. Amount: (refer to Gold Eq. Amount).
(@ current Au/Ag prices)
Potential Profit: This is the maximum profit this company can make using current gold and silver prices. If the company managed to mine and sell every ounce, how much could they make?
Cash Flow Amount: This the future cash flow using current gold/silver prices.
Cash Flow Multiple: This is the future cash flow multiple using current gold/silver prices.
Cash Flow Growth: This is the cash flow growth using current gold/silver prices (comparing the current cash flow to future cash flow).
(@ future Au/Ag prices)
Mkt Cap Amount: This is the project future market cap. Here is the calculation:
Future Mkt. Cap = ((Gold P & P Future Est. x Future Gold Price) + ( Silver P & P Future Est. x Future Silver Price)) x Future Mkt. Cap Multiplier
Mkt Cap Growth: This is a comparison of the current fully diluted market cap to the projected future market cap.
Cash Flow Amount: This is the future cash flow using future gold/silver prices (refer to Defaults). Here is the calculation:
Cash Flow Amount = (Gold p/a x (Future Spot Price - Cost)) + (Silver p/a x (Future Spot Price - Cost))
Cash Flow Multiple: This is the future cash flow multiple using future gold/silver prices (refer to Defaults). Here is the calculation:
Cash Flow Multiple = Future Mkt. Cap / Future Annual Cash Flow
Cash Flow Growth:This is the cash flow growth using future gold/silver prices (comparing the current cash flow to future cash flow). Here is the calculation
Cash Flow Growth = Future Cash Flow / Cash Flow) - 1; // -1 because 3/1 = 200%, not 300%
Current Market Cap / Future
Gold Eq Reserves: This is a comparison of projected future gold equivalent reserve ounces to the current market cap.
Silver Eq Reserves: This is a comparison of projected future silver equivalent reserve ounces to the current market cap.
Gold Eq Production: This is a comparison of projected future gold equivalent annual production ounces to the current market cap.
Silver Eq Production: This is a comparison of projected future silver equivalent annual production ounces to the current market cap.
Note: Gold and Silver equivalent reserves/production are calculated by using the future prices on the defaults page (refer to Defaults) to obtain the future gold/silver ratio.
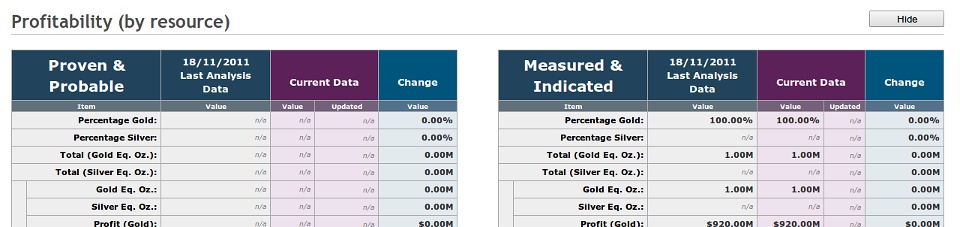
Current Valuation Metrics (based on plausible oz.)
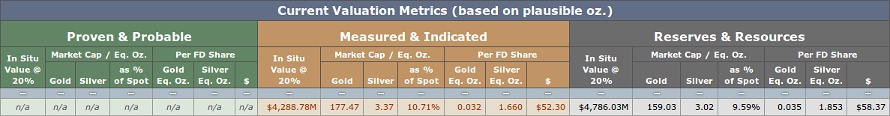
This section is for analyzing the current valuation of the company. I might take a quick glance at this section, but I am more interested in the future valuation. However, it is good confirmation if both the current valuation and future valuations are both highly undervalued.
Proven & Probable / Measured & Indicated / Reserves & Resources
I have included the column descriptions for all three resource categories here, because the descriptions are the same. Please refer here (need) for explanations of each resource category.
In Situ Value @ 15%: This the current resources or reserves (depending on the resource category) in situ value at 15%. Here is the calculation (need).
Gold Market Cap / Eq. Oz.: This is a comparison of gold equivalent ounces to the current market cap.
Silver Market Cap / Eq. Oz.: This is a comparison of silver equivalent ounces to the current market cap.
As % of Spot Market Cap / Eq. Oz.: If the company type is Gold, then this is the current gold spot price compared to the Gold Market Cap / eq. oz.
Gold Eq. Oz. per FD Share: This is a comparison of gold equivalent ounces to the fully diluted shares.
Silver Eq. Oz. per FD Share: This is a comparison of silver equivalent ounces to the fully diluted shares.
$ per FD Share: This is the dollar value of each fully diluted share based on the current market cap and the number of fully diluted shares. Here is the calculation:.
$ per FD Share = Gold* Eq. Oz. per FD Share x Gold* Spot Price
* - gold is used but actually... silver values render the same result, since they are equivalent ounces.
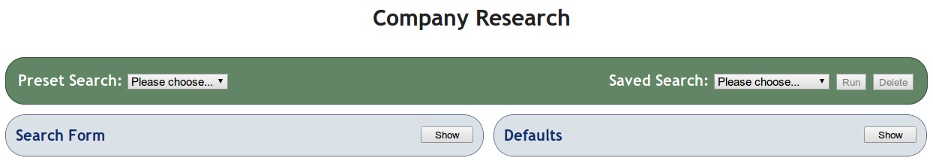
Saved Search
The saved search drop-down list is at the top of the search & compare page. These are personal searches saved by members. They are used to populate the search & compare page with a list of stocks.

To use a saved search, you select it from the drop-down list and click the Run button. You can also delete an existing saved search using the Delete button.
Saved Searches are created from the Search Form (refer to Search Form). Every time you create and run a custom search, you will have the option to save it.

Search Form
This the most powerful feature on this website and should be used extensively to find undervalued stocks. My goal was to create an easy to use, flexible, query tool, and the web developer did exactly that.
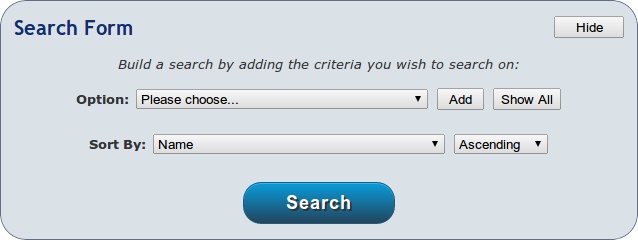
Above, is the first thing you see when you open the search form.
- Option: This is a drop-down list of all searchable options. Most of these are columns in the research output, but some are not.
- Add: This will add the selected option as a possible search criteria.
- Show All: This will add all of the searchable option as possible search criteria.
- Sort By: This is the column that will be sorted.
- Ascending: You can select either ascending or descending for the sort order.
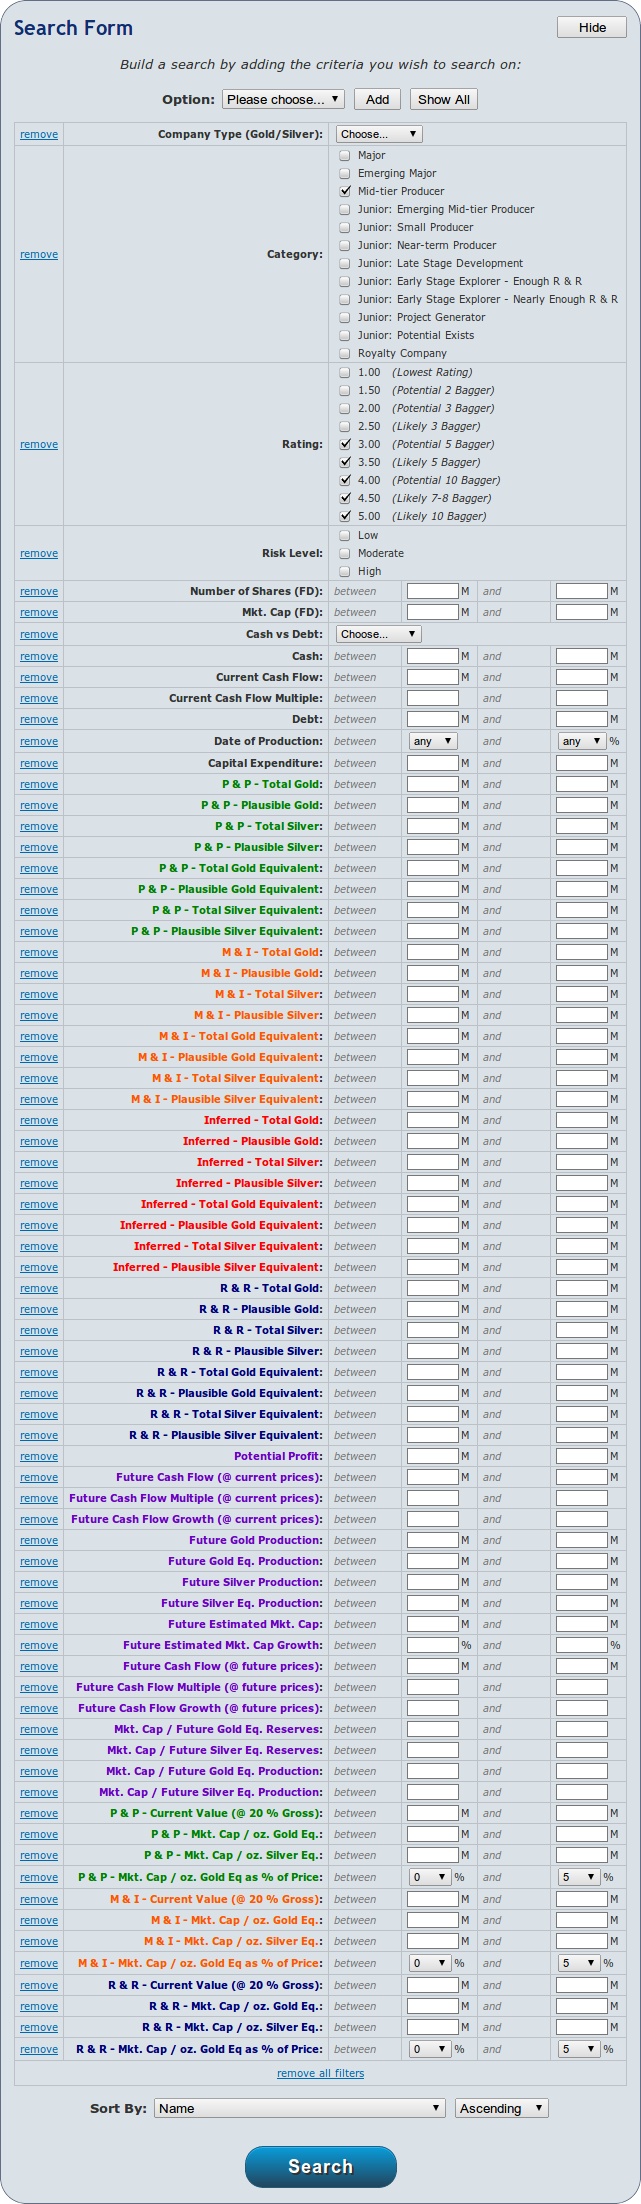
In the Option drop down, select a search option and then click the add button. As you add options, they will appear as search criteria as unchecked check-boxes. For instance, below I added Rating and Category:
I checked mid-tier producer and four ratings. I can now click the search button and it will find all stocks that match this criteria. After the search runs, I can save this search and give it a name by clicking on the "Save Search" button.
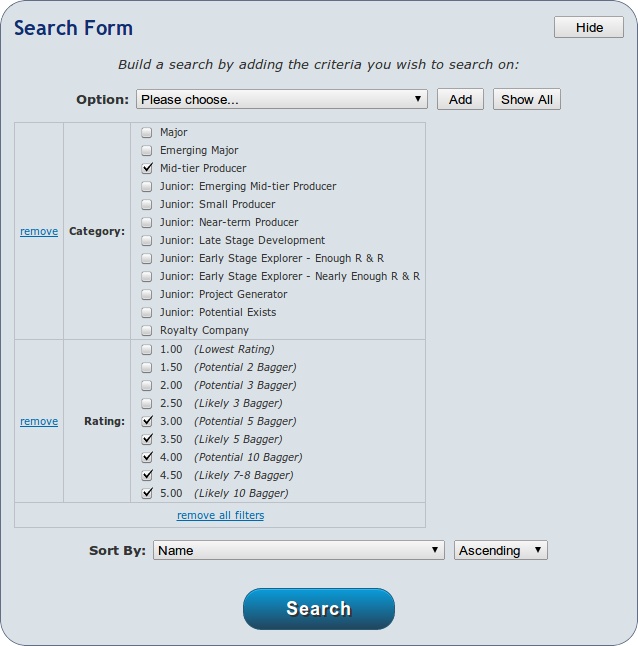
There are two links that appear on the search form. The remove link will remove the option from the criteria list. The "remove all" link will remove all options, and you can start over.
The "Save Search" button is somewhat confusing, because of two extra options you are given. I will try to explain how it works.
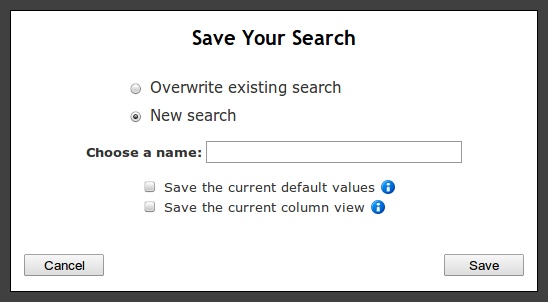
The first two options are easy enough. If it is a new search, you enter a name for the search, and then click the Save button.
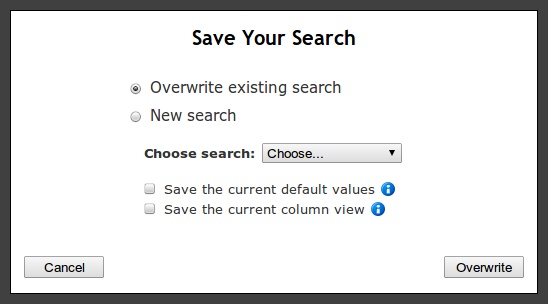
To update an existing search, you select the existing search in the drop-down, then click the Overwrite button.
That was easy enough, but what are those two check boxes at the bottom?
Each saved search can either use the default values at the time the search was saved, or the default values that exist in the future when you run the query again.
The current column view is the current columns that are displaying in the research output. If you want these columns to always display for this search, then check the check-box.
For most queries, I would leave these boxes unchecked. This way you will always use the most recent defaults and whatever columns happen to be visible.
You can click on the blue information icon for an explanation if you forget.
Search Options
Search form showing every option
(Click to see full size)
(Click to see full size)
There are many search options, so I will list each option. For most of the options you can refer to the research section.
| Company Type | Currently you can only search for "Mostly Gold" or "Mostly Silver". |
| Category | These are the 12 company categories (see Categories and Category Codes). |
| Rating | These are the 9 company ratings (see Ratings). |
| Risk Level | Currently there are only High, Moderate, and Low. |
| Number of Shares (FD) | Number of fully diluted shares. Enter a range in the millions. |
| Mkt. Cap (FD) | Current fully diluted market cap. Enter a range in the millions. |
| Cash vs Debt | You have two choices: Cash greater than Debt, or Cash less than Debt. |
| Cash | Current cash level. Enter a range in the millions. |
| Current Cash Flow | Current cash level. Enter a range in the millions. |
| Current Cash Flow Multiple | Current cash level. Enter a range in the millions. |
| Debt | Current cash level. Enter a range in the millions. |
| Date of Production | Estimated year of production. Enter a range in years. |
| Capital Expenditures | This CapEx for their current project. Enter a range in millions. |
| [Resource Type] - Total Gold | Total gold ounces. Enter a range in millions. |
| [Resource Type] - Plausible Gold | Total plausible gold ounces. Enter a range in millions. |
| [Resource Type] - Total Silver | Total silver ounces. Enter a range in millions. |
| [Resource Type] - Plausible Silver | Total plausible silver ounces. Enter a range in millions. |
| [Resource Type] - Total Gold Equivalent | Total gold equivalent ounces. Enter a range in millions. |
| [Resource Type] - Plausible Gold Equivalent | Total plausible gold equivalent ounces. Enter a range in millions. |
| [Resource Type] - Total Silver Equivalent | Total silver equivalent ounces. Enter a range in millions. |
| [Resource Type] - Plausible Silver Equivalent | Total plausible silver equivalent ounces. Enter a range in millions. The Resource Type can be P&P, M&I, Inferred, or R & R. |
| Potential Profit | Future (3-5 years) potential profit. Enter a range in million. |
| Future Cash Flow (@ current prices) | Future (3-5 years) cash flow using current gold/silver prices. Enter a range in million. |
| Future Cash Flow Multiple (@ current prices) | Future (3-5 years) cash flow multiple using current gold/silver prices. Enter a range 0-100. |
| Future Cash Flow Growth (@ current prices) | Future (3-5 years) cash flow growth using current gold/silver prices. Enter a range 0-1000. |
| Future Gold Production | Future (3-5 years) annual gold production. Enter a range in million. |
| Future Gold Eq. Production | Future (3-5 years) annual gold equivalent production. Enter a range in million. |
| Future Silver Production | Future (3-5 years) annual silver production. Enter a range in million. |
| Future Silver Eq. Production | Future (3-5 years) annual silver equivalent production. Enter a range in million. |
| Future Estimated Mkt Cap | Future (3-5 years) estimated market cap. Enter a range in million. |
| Future Estimated Mkt Cap Growth | Future (3-5 years) estimated market cap growth. Enter a range in million. |
| Future Cash Flow (@ future prices) | Future (3-5 years) cash flow using future gold/silver prices. Enter a range in million. |
| Future Cash Flow Multiple (@ future prices) | Future (3-5 years) cash flow multiple using future gold/silver prices. Enter a range 0-100. |
| Future Cash Flow Growth (@ future prices) | Future (3-5 years) cash flow growth using future gold/silver prices. Enter a range 0-1000. |
| Mkt. Cap / Future Gold Eq Reserves | Current market cap divided by future (3-5 years) estimated gold equivalent reserves (total ounces). Enter a range 0-1000. |
| Mkt. Cap / Future Silver Eq Reserves | Current market cap divided by future (3-5 years) estimated silver equivalent reserves (total ounces). Enter a range 0-1000. |
| Mkt. Cap / Future Gold Production | Current market cap divided by future (3-5 years) estimated gold production (annual total ounces). Enter a range 0-1000. |
| Mkt. Cap / Future Silver Production | Current market cap divided by future (3-5 years) estimated silver production (annual total ounces). Enter a range 0-1000. |
| [Resource Type] - Current In Situ Value (@ 15%) | In situ value for resource type at 15%, using current gold/silver prices. Enter a range in millions. |
| [Resource Type] - Mkt. Cap / Total Gold Eq. Oz. | Current market cap divided by current total gold equivalent ounces. Enter a range in millions. |
| [Resource Type] - Mkt. Cap / Total Silver Eq. Oz. | Current market cap divided by current total silver equivalent ounces. Enter a range in millions. |
| [Resource Type] - Mkt. Cap / Total Gold Eq. Oz. as % of Spot Price. | Current market cap divided by current total gold equivalent ounces as a percentage of the current spot price of gold. Enter a range as a percentage. |
Note: The [Resource Types] available to search by are P&P, M&I, and R & R. The same as displayed in the research output.
Wiki
The wiki is available for members. It is your own personal notes page for each stock. It is accessible from both the Companies page and the Research page.
Once you click on the Wiki link, you can add and modify this page with anything you want.
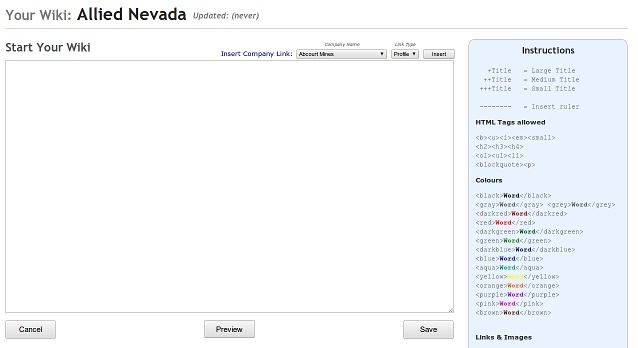
You can write and format text, insert images, and insert links. There are instructions for allowed html tags, and changing the size or color of the text.
There are also several default links that you can insert. One thing that is really cool, you can insert the profile and notes for any existing company. You can even combine companies in the same wiki. Also, you can insert another company's wiki as a link.
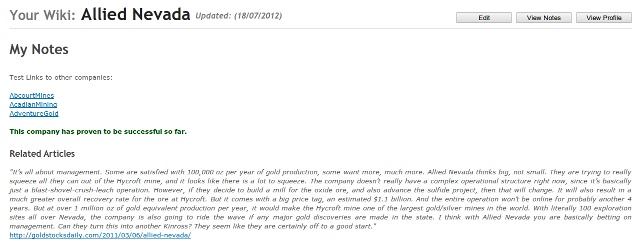
Here is an example:
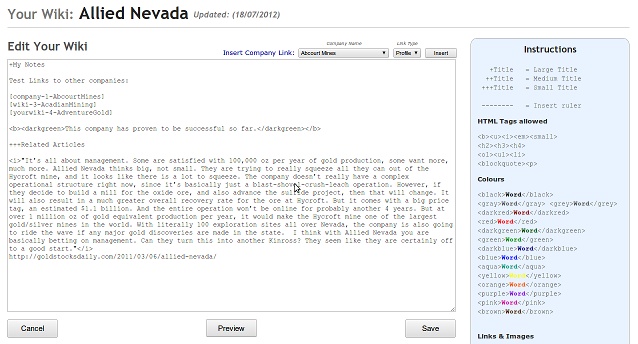
Here is how that displays...
Follow