Subscribe Now - Standard: only $199 per year or Premium: only $299 per year - Click Here
|
|
Login:
April 2020 CommentaryIt's time to be excited about gold and silver mining stocks. I am not ready yet to break out the champagne, but all signs point the beginning of a gold and silver bull market. Gold closed over $1700 last week for the first time since 2011 and the GDX chart clearly looks like a breakout (see below).
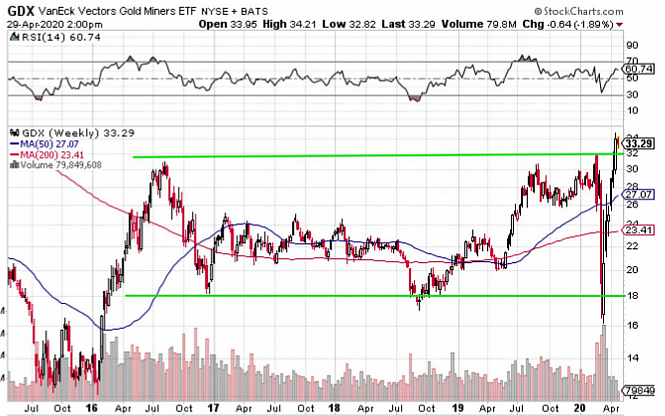 The GDX chart looks a lot like the gold chart before it broke out at $1370 in June 2019. It has taken a few months for the miners to believe that the gold breakout was real, but that time appears to have arrived. Can we be confident that this breakout in GDX is real? I would say yes. Why? Because gold usually goes up during a recession. This is why I have focused so much over the past year on macroeconomics to identify the next recession. During the last two recessions (2001, 2008), gold increased in value. Moreover, after the recessions ended, we had massive moves up in gold and silver ming stocks. I'm expecting that to occur this time as well. The reason I'm not ready to break out the champagne just yet, is because of two issues that could rain on our parade. The first is that this recession is just getting started and all of the selling in the stock market is not over. We could get another big leg down in the markets that could take the miners and gold down with it. Secondly, silver hasn't yet joined the party. It's hard to get excited with silver at $15. The good news is that both of these issues are to be expected at the beginning of a recession. However, at some point the markets will find a bottom, and then the recession will end. That is when we can expect silver to join the party, and perhaps, long before the recession ends. Jeff Clark recently posted an article on GoldSilver.com: Why Is Silver Stagnant, and When Will it Start Moving? Here is the link: https://goldsilver.com/blog/why-is-silver-stagnant-and-when-will-it-start-moving/ He did an excellent job showing how silver usually falls during a recession and then takes off after the recession ends. This is what happened in both 2002 and 2008. So, we just need to be patient for silver to join the party. After both of these recessions, silver outperformed gold, and I expect it to this time as well. I think we are at the beginning of the next bull market in gold, but the bull market in silver clearly hasn't begun. For that to happen, I want to see silver close above $18.50 for two weekly Friday closes. Then I will be confident that the silver bull market has officially started. The gold bull market actually began in June 2019, when gold closed above $1370 for two weekly closes. In fact, it never retested $1370. Instead, it just blasted off. I don't think $1370 will get retested for several years, but we could see a sharp correction before we reach a new high above $1935. Don't expect an easy ride. A bull market always tries to buck-off the longs. It wouldn't surprised me to see sub $1600 soon, and perhaps sub $1500. But if this is a new bull market in gold, the correction will be short-lived. In addition to the normal corrections to be expected, we also have to deal with manipulation. There are some players with deep pockets who do not like gold & silver to perform well. I call these players the banksters, and they like to dump billions of dollars in paper gold in very short timespans. This morning they dumped $1.5 billion in a few minutes. Here is a screenshot from ZeroHedge. 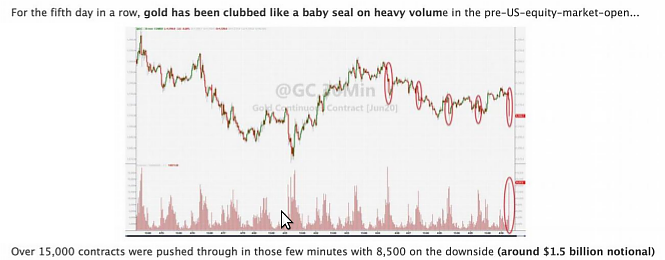 They have been dumping on the pre-open to get gold & silver to open lower. It's like the previous day didn't matter. This screenshot tells all you need to know about manipulation. Yes, it's real, and these banksters have been fined before for doing it. These beatdowns have kept gold under $1800 and silver under $16, and the beatings will continue. But at some point, they will lose control. I don't know when silver will make its move to $18.50, but I think the signs say to be patient. Inflation is coming, which should be a trigger for silver. How can we not get inflation with the trillions in money printing by the Fed? And much of it was helicopter money that does not need to be paid back. I don't know how long this gold bull market will last, or how high gold prices will reach, but what has become apparent is that this recession will last longer than the 2008 recession. We are looking at a 2-3 year period of stagnation, with steady high unemployment. I think that is a good ballpark estimate for the length of this gold bull market, and it could last longer. When I created this website in 2012, I used a future gold price of $2500. I used this high price because I anticipated a severe economic crisis such as the one we are now experiencing. I think we can now all say with confidence that we expect to see gold reach $2500, or very close to that price. In fact, it could go even higher. So, it is game on. The gold stocks that we hold can now be valued at $2500 to determine our expected returns. Or, we can look at stocks that we don't own valued at this level, and find opportunities. We are ahead of the curve because we have anticipated this outcome and planned for it. The GSD website has always been focused on future valuations at future gold prices. My stock lists all incorporate these future gold price expectations. While it looks like we have found the gold bull market we have anticipated, it's possible the economy will roar back to life and MMT will be a success. As Hugh Hendry recently wrote: "You can print as many dollars as you damn well please, as long as the yield curve doesn't steepen ... you're good to go and MMT is dope." His point is that MMT (modern monetary theory) could work, but it could also be a big failure. If the Fed can't control the yield curve (interest rates), everything blows up. The Fed is now buying U.S. Government bonds at a massive pace. So, they are setting short-term rates and then trying to control short-term and long-term rates through bond purchases. In theory, this is total insanity, but that is where we are. The U.S. Government deficit will be at least $3 trillion in 2020. It is expected to be $3 trillion in 2021 and $2 trillion ion 2022. Interest payments will be at least $500 billion in 2020. We have reached unchartered waters. I've always expected the Fed to monetize the U.S. debt, and expect it to fail. Amazingly, the markets think it can be done. If I'm right, gold goes to the moon. If I'm wrong, gold goes a bit higher, but could languish as an unneeded asset. I've always said, the key to gold is the fear trade. Currently, the fear trade is alive, but it has not yet reached levels that push gold to a new high. Today, the Fed still has the confidence of the investor class. If that confidence begins to waver, the run to gold should be explosive (and the banksters will get overrun). Also, if inflation begins to tick up, that will create demand for gold. There are two main drivers for gold. The first is the fear trade, which drives investors to hedge for potential bad outcomes. In this scenario, investors buy gold as an asset that should hold its value while everything else crashes. The second driver is inflation. Here, gold is bought because it will outperform cash. It's a simple trade, you convert cash (which is losing value) to gold (which is holding its value). I would prefer to have a fear trade rather than an inflation trade. If we get an inflation trade, it limits our returns as prices rise for everything. Ideally, I would prefer low inflation and a big rise in gold prices from the fear trade, but that is an unlikely outcome. If we do get a significant fear trade, it will likely be accompanied by inflation. So, the ultimate driver for gold is fear of systemic economic collapse in tandem with inflation fears. Now that this recession has begun and the gold story is unfolding as expected, the only questions left for gold investors to ask is how much fear and how much inflation will see see in the next 2-5 years? I suppose there is another important question, which is how long will the gold bull market last? I usually give you a few macroeconomic charts each month, but I think we are all aware of what is happening. The economic charts are currently meaningless until the economy restarts and we find out the new consumer spending number, which is 70% of the economy. GDP was down 4% in Q1, signaling the onset of the current recession. Q2 will see GDP drop more than 15% (year-on-year). I expect Q3 and Q4 to also be negative, with a slow sluggish return to normalcy. The economic charts probably won't have any meaning until at least July because consumer spending will be dead until then. Several important industries are currently dead, such as oil, housing, and autos. But perhaps the most important economic engine is consumer spending. How is that going to get its mojo back? I would expect unemployment to stay above 10% for quite a while. PMIs (services or manufacturing) are also dead. We probably don't need to look at PMIs for a few months. They will be very slow to regain strength. I would not expect to see a 50 reading (year-on-year) on a PMI for at least a year. All of this economic weakness should be good for gold because it instills fear, and drives investors to hedge. The other thing that is going to instill fear is exploding U.S. government debt that will create the need for constant borrowing. There is going to be one large U.S. Treasury auction after another over the next three years. The Fed plans to be the buyer of last resort, but will this work? I have my doubts. Another factor that will instill fear is the petro-dollar and the potential loss of the U.S. dollar as the global reserve currency. The petro-dollar is the term used for oil traded in U.S. dollars. Not too long ago, 100% of oil traded in dollars. This is slowly changing and threatens the dollar as the global reserve currency. If Saudi Arabia decides to sell their oil in a currency other than the dollar, that could create widespread fear and a run to gold. When you consider the economic predicament that we are in today, it's a wonder that gold is below all-time highs and silver stuck at $15. It seems like precious metals are expecting a return to economic growth in the near term. If this expectation is not met, then gold and silver will head higher. At least that is my expectation. Let's look at a few charts. 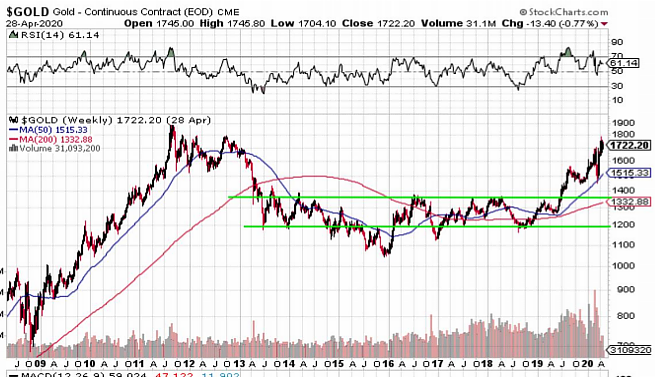 The gold chart (see above) looks very strong (an understatement). It has broken out of a long channel and now has a lot of support at $1550 and $1500 where it has traded in recent months. It won't be easy to push it down and keep it down the rest of this year. 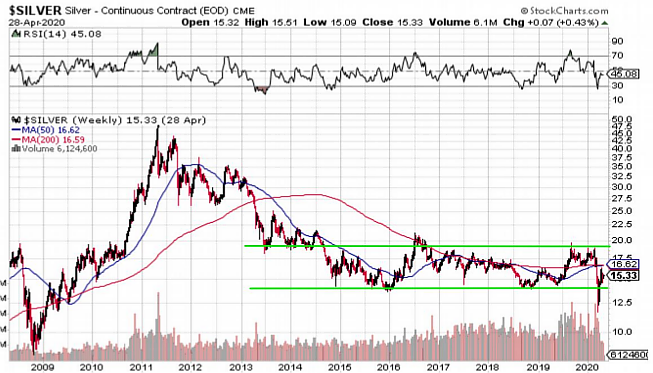 The silver chart (see above) clearly has not broken out yet. But when it does, it should be spectacular. I like the lack of resistance from $22 to $27. I expect the move from $18.50 to $27 to take only a few months. 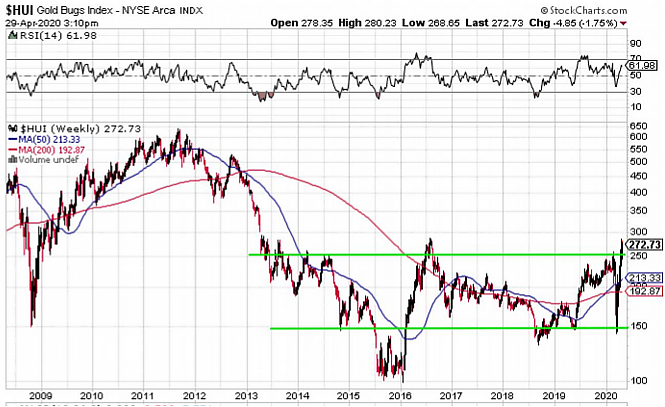 The HUI (see above) looks a lot like the GDX chart, and is also currently breaking out. This is an exciting chart because of the lack of resistance from 300 to 400. This is likely where silver joins the party. When the HUI is jumping from 300 to 400, silver will probably be jumping from $22 to $27. The charts confirm the macroeconomic data and Fed insanity. Everything points to a near-term breakout in gold, silver, and the miners. It could take 2-4 months, but the charts seem to imply it is on the way. If the HUI is below 300 when we get to July, I will be surprised. The one factor that could slow things down is silver (also manipulation). It's possible for silver to remain stuck for the rest of the year based on historical outcomes. The longer the recession lasts, the longer silver could be kept down. |
Follow us on: