Subscribe Now - Standard: only $199 per year or Premium: only $299 per year - Click Here
|
|
Login:
March 2020 CommentaryThe last few newsletters have focused on charts that implied that a recession was looming. I am a believer that gold will only breakout if there is a fear-trade that drives it to a new high, or above $1700. Without fear, investors will avoid gold.
Well, we finally got our black swan event (the coronavirus) that has moved the economy into a recession. Now we wait to find out how strong the fear-trade becomes. Will we get a move above $1700? It seems likely, but the unknown is how much higher above $1700 will gold go, and will it stay above $1700? Back in 2011, it didn't stay above $1700 for very long (only a few months). Some economists are projecting that we won't even have a recession. They are expecting positive GDP growth in Q1 and Q3. That is a possibility, but I'm expecting negative growth in Q1 and Q2 like this chart below from Goldman Sachs. 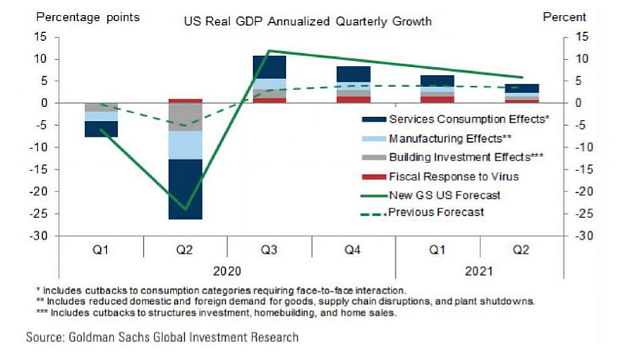 The chart above is expecting an extremely short recession with huge growth in Q3 and Q4, and then solid growth in 2021. I think this chart is overly optimistic. This virus pandemic is going to knock the US economy off its feet, with unemployment reaching at least 25% in April. Thinking that it will quickly rebound seems like pie in the sky fantasy. What is more likely is an extended recession for the rest of 2020, if you use year-on-year growth. One thing we know for sure is that Q2 is going to be a disaster. GDP in Q2 will crash at least 10%. The entire month of April will likely be a US lockdown of non-essential businesses. The amount of money that will be lost will be enormous. The Fed and the US Treasury will both be injecting money into the economy, but it won't be enough to offset the losses. Consumers are going to get a few small checks, but many corporations are going to get large checks into the billions each. This is how the American government works. We have socialism for corporations and capitalism for consumers. For this financial crisis, the government has become even more aggressive, allowing the US Treasury to request money from the Fed (any amount) to purchase stocks and bonds. This has never been done before. This injection by the US Treasury is helicopter money, and in theory, it is illegal. I say that because the Fed's charter does not allow them to give money to the US Treasury and the charter is not being changed. Instead, Congress is simply telling the Fed to print the money (digitally out of thin air) and send it to Blackrock Corp (the US Treasury custodian) on Wall St. Then Blackrock will obtain the stocks and bonds that the US Treasury requests. I'm not surprised helicopter money is being used. MMT (modern monetary theory) has been the norm for US economic policy since 2001. Every country is using it more and more. We are simply copying what Japan has been doing. Today Japan's government (or central bank) owns more than half of their stock market ETFs, and a large portion of their bonds. MMT is the term applied to Japan's strategy (beginning in the early 1990s) of printing money to avoid an assortment of economic ills (loan defaults, bankruptcies, liquidity problems, interest rate increases, slow economic growth, decreasing stock demand, etc). Japan decided that money printing could be used to combat all of these ills. Today, Japan's government has very high debt and their central bank has a large balance sheet. But, they have been able to maintain economic stability since their economic crisis in 1989. If you go to Tokyo today, you will see vibrancy and there are very few signs that MMT has created havoc on their society. In fact, the opposite is true, and thus the allure of MMT. While MMT has prevented economic collapse in Japan, it has not created economic vibrancy. In fact, Japan has been in a slow slug of growth since 1989, with several periods of slightly negative growth. They have had to rely on low interest rates and ongoing money printing (MMT) just to keep slow growth alive. They now seem to be trapped by this policy and a reliance on more and more debt. MMT is voodoo economics. However, when the other option for politicians is a massive economic collapse, MMT becomes very attractive. The irony is that we know MMT can only go so far and it is dangerous. Yet, politicians and economists pretend that it is not, and that it is in fact the smart thing to do (just listen to the Fed describe their strategy). If MMT was truly a magic bullet, we would cancel income taxes and have the Fed print everyone a check every month (Andrew Yang's idea). Clearly, that isn't an option. So, now we wait to see the fallout of MMT, and the plethora of dollars that will be printed (likely more than $10 trillion). This MMT will be divided between Fed digital money printing and US Government borrowing. In addition to the first wave of printing, both the Fed and the US Treasury will stand ready to print more until the economy is back on its feet. Will this MMT experimentation work and prevent a major recession? Perhaps. But gold should benefit as the dollar becomes devalued and investors fears spark a run to gold to protect against inflation. Also, MMT will be accompanied by low interest rates, which should help gold. I have no idea if gold will make a run to a new high. Why? Because MMT could allow the politicians to kick the can down the road for a few more years. MMT might work, or it might not. What gives me hope that gold will break out is that the economy is going to be severely damaged in March and April. This will keep interest rates low for an extended period, thereby keeping real-rates very low and possibly negative. That is good for gold. I have almost no fear that gold is going to crash (sub $1400) this year. The gold chart is still very strong (see the weekly chart below) and I don't see anything that could push it below $1400. As long as gold stays above $1370 (a key technical level), the chart remains strong and positioned for a run to a new high. The combination of a 7-year base, along with a solid breakout should support gold in 2020. This is not a chart that looks like it is going crash. Not even close. 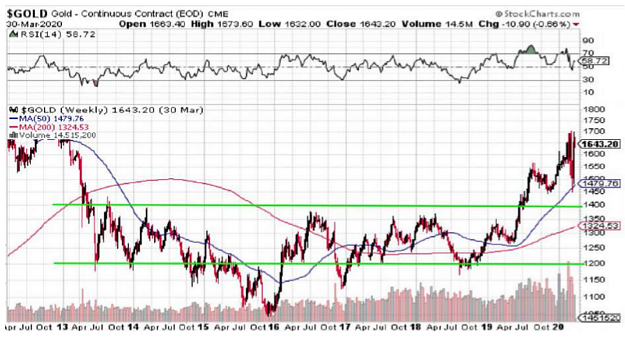 While gold looks strong for 2020, it wouldn't surprise me if it gets stuck in a trading range of $1450 to $1650. This could happen if the fear-trade doesn't kick-in strongly. If investors remain confident in bonds and cash, then they will be hesitant to convert those assets into gold. If investor's continue to believe that central banks have the magical power to pull the right levers and keep they economic system afloat, there might not be a run to gold. What we need is for either inflation to rise or bond defaults to become widespread. My fear is that the Fed and US Treasury will defend the bond market and will bail out bonds. They already shown a willingness to do that with the bailout of Capital One this week. It's going to be interesting to see how many junk bonds they bail out. I have read that there is $3 trillion in junk bonds that are at risk of insolvency. Many of these will end up in the US Treasury Blackrock account, and the banksters will be made whole. So, without inflation or bond defaults, gold will have headwinds obtaining a new high or getting above $1700 and staying there. Another number that bothers me at the moment is the silver spot price. The physical demand for silver at the moment is massive. However, the banksters control the spot (paper) price through future contracts. The banksters know that the retail crowd (me and you) prefer silver and will buy it once it begins to trend. The banksters know that the retail crowd prefers to buy a trend, and once silver goes to $18, $20, $25, $30, the crowd will become huge. The banksters don't want that. Silver is the canary they don't want visible. They do not want the retail crowd to consider gold and silver as money. 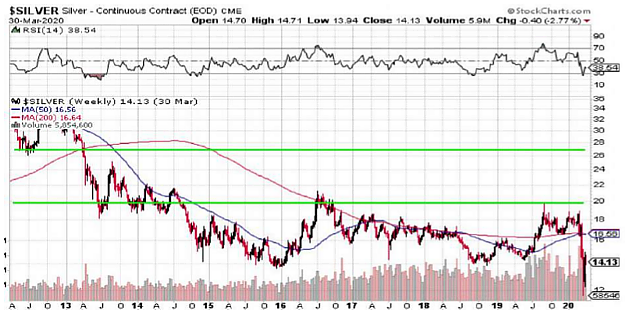 If silver gets over $18.50, they will lose control of the price. It wouldn't surprise me at all if silver hits $50 this year. Conversely, it might stay under $18.50. The run from $20 to $27 could easily occur in a single month and then from $27 to $50 in another month or two. It could be that fast. Why $27? Look at the chart above. That's the technical level with a big magnet on it. Look at the gap from $20 to $27. It's a huge air bubble. We went from $27 to $20 in a single quarter in 2013. That is now set up for a retracement from a huge base going back to 2013. The banksters do not want silver to be perceived as money. They do not want the talking heads on CNBC to mention silver. The day that happens we will see $27 very quickly. Trust me, the banksters and large investment banks (Goldman, JP Morgan, and Morgan Stanley) are scared to death of silver going up. This frightens their customers and flashes a spotlight on Exter's Pyramid. Isn't it interesting that JP Morgan owns more physical silver than any entity? They don't want their customers to own it, but they do. The old axiom applies: watch what someone does, not what they say. The fact that silver is sub $15 shows their fear, because clearly it is being pushed down by the banksters with paper selling (if more people sell paper silver than buy, the spot price drops). Can they keep it down? We'll see. I know that I won't get excited until we get above $18.50. Until then, consider me a frustrated PM investor. Below is the DOW weekly chart. Notice two things. First, notice that we are below the 200 WMA. Second, notice the green arrow around at 18,000. Expect that to get retested. 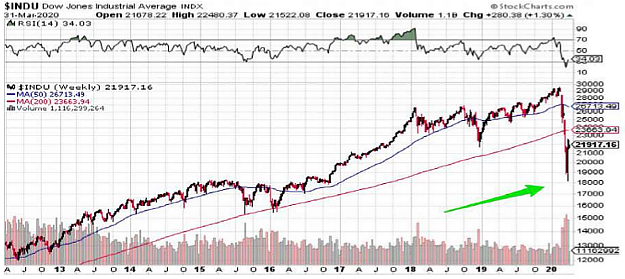 The banksters want to keep silver low (below $18) and they want to stay above the recent DOW 18,000 low. Ideally, they want to get above the DOW 200 WMA (the red line). Next month, we'll see how they do. Below is a chart of previous bear markets. This one was the faster ever recorded (see green arrow). Part of that was the coronavirus, but don't discount MMT's impact, and the huge debt and leverage that exists in the market today. 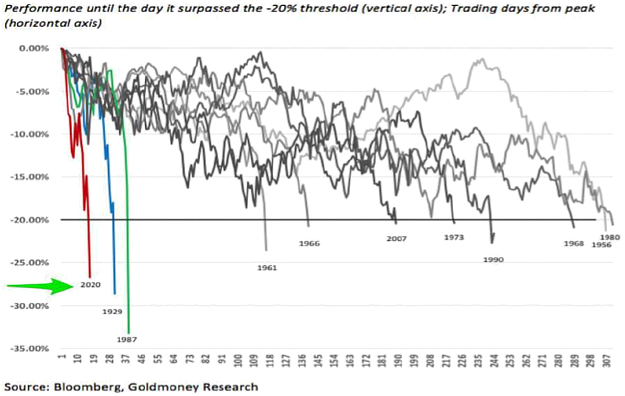 I don't think anyone knows the economic fallout from this virus. But MMT and QE seem to be good at kicking the can down the road. I don't think we are heading into a depression or the stock market crashing to sub 10,000 or even sub 15,000. Perhaps I am being naive, but I expect the virus to peak in April or May. It seems to have already peaked in Asia. When all of the selling started intensifying around 25,000, I thought perhaps a major bankruptcy (Lehman event) would materialize along with defaulting bonds. But now I'm not so sure. Governments are throwing so much money at bailouts, that if any significant business gets into trouble, they just need to raise their hand and billions are on the way (unless you are a cruise company registered in Panama to avoid paying taxes!). 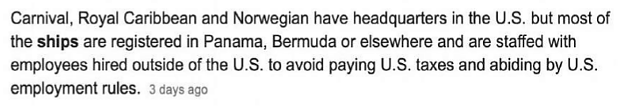 So, our politicians and the Fed will utilize MMT in an attempt to prevent an extended financial crisis. Depending on their degree of success, or utter failure, it will impact the gold fear-trade. It could be huge, or perhaps peter out. We'll find out. I think April will be a very important month for the markets, because the assumption is that the virus should peak in April. By the end of April, we should have a much better understanding of the economic fallout. The chart below is interesting. It shows how much gold fell in price when the markets sold off in 2001 (8%) and 2008 (30%). This time gold has gone up! Perhaps that is a good sign, because after the last two recessions, gold went into a bull market as the fear-trade kicked in. We saw big moves in gold from 2002 to 2008 and from 2009 to 2012. 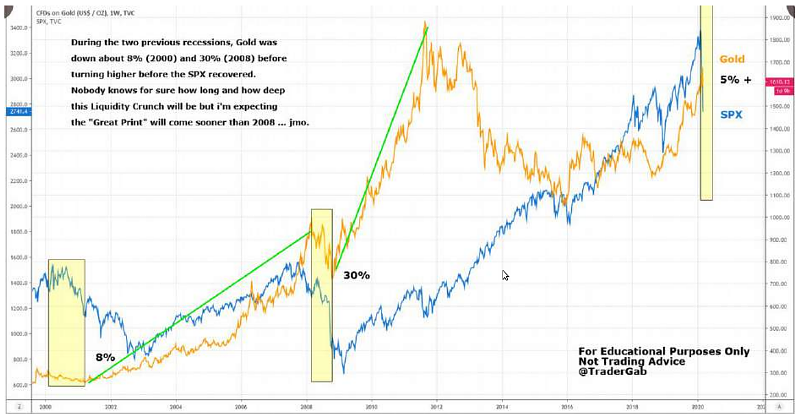 If the chart above repeats, then we should be entering another gold bull market. That means we should see a new high above $1935. Fingers crossed. The chart below shows that gold & silver miners just had their worst quarter (share performance) in history! This shows how terrible sentiment currently is with miners. The HUI is around 200 and gold is over $1600. That's a huge divergence. The HUI should easily be above 250 with gold that high. IMO, the gold miners are currently highly undervalued versus the gold price and are being stretched like a rubber-band. The HUI could easily double if gold gets above $1700 and stays there. 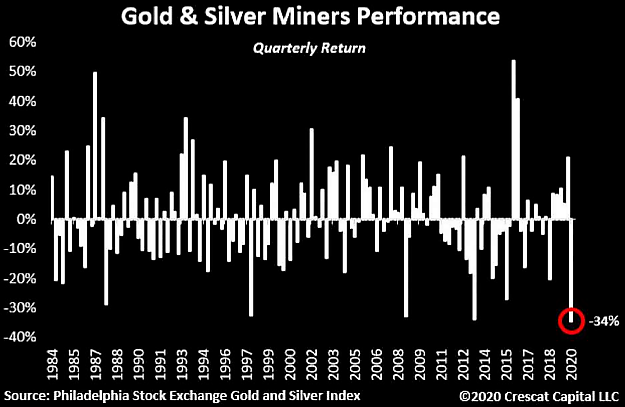 Looking at the chart above, when gold and silver miners crashed back in 2008, 2013, and 2015 (30% or more), they were all followed by rallies within then next two quarters. If that repeats, then we should get a good quarter in 2020. The chart below shows the US 10-Year bond rates (2006-2020). It has crashed from 3% in 2019 to .5% today. That is stunning and shows the degree economic turmoil we are facing. With rates this low, if the economy doesn't come back, then what? The Fed is out of bullets except for MMT. 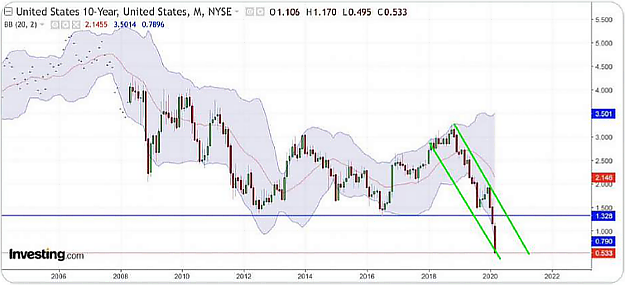 The GSR (gold/silver ratio) has surprised me by blasting off (see below). The banksters couldn't keep gold down (in 2008 they pushed it down 30%), but they had success with silver, which is a smaller market. So, we witnessed a 122 GSR. I have no doubts that this will not last long. My expectation is for the GSR to go sub 40 during the next gold bull market. 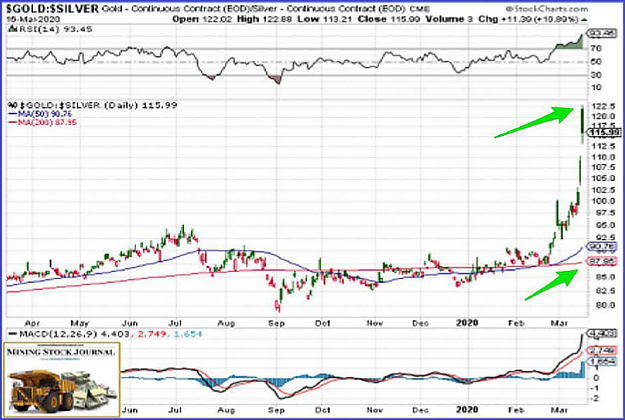 Note that today the GSR physical price as set by Ebay sellers is 72 (Gold Eagle $1800 / Silver Eagle $25). One of these days, the silver producers will realize they are getting hosed and sell silver directly to the market at higher prices, or just hoard their inventory. One final comment on the economy. In April, the following industries will get obliterated: retail, hotels, airlines, oil, travel, car & truck sales, small businesses, casinos, cinemas, cruise lines, and many others. There is going to be fallout and uncertainty reigns. Any way you look at this, gold and silver have to benefit. The only question is how much and for how long? |
Follow us on: